
Role: UI/UX Designer
Tool: Figma, WordPress, Gmeet, AI illustration
1. Project Overview
ISPO Track is a centralized digital platform that simplifies the Indonesian Sustainable Palm Oil (ISPO) certification process. It connects all key stakeholders—ISPO Committee, Certification Bodies, the National Accreditation Committee, and palm oil businesses—through a single dashboard.
Applications, reviews, and approvals are now managed online in real time, replacing manual paperwork. Built from earlier UI concepts, the platform has evolved into a role-based system to enhance usability and efficiency.
2. Background & Problem
Before ISPO Track, the entire certification process was manual. Submissions happened through email. Documents were passed around. Data lived in spreadsheets and inboxes across different organizations.
There was no centralized platform—no single source of truth. As a result:
- Submission workflows were confusing and time-consuming
- Applicants didn’t know the status of their certifications
- Coordination between the ISPO Committee, Certification Bodies, and National Accreditation Committee was inefficient
- Key information was scattered or even lost in the shuffle
3. Goals & Objectives
- Bring everything into one centralized, role-based dashboard
- Make the process faster, clearer, and more transparent for everyone
- Guide users step-by-step through application and review stages
- Enable secure data sharing with access based on user roles
- Replace manual workflows with digital ones: online forms, uploads, notifications
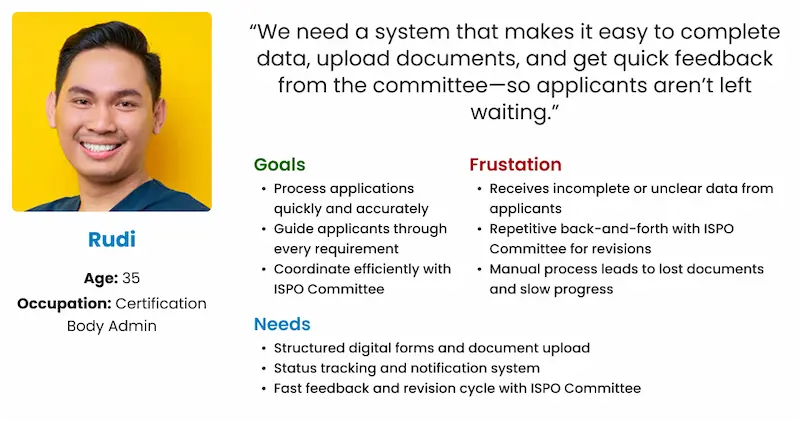
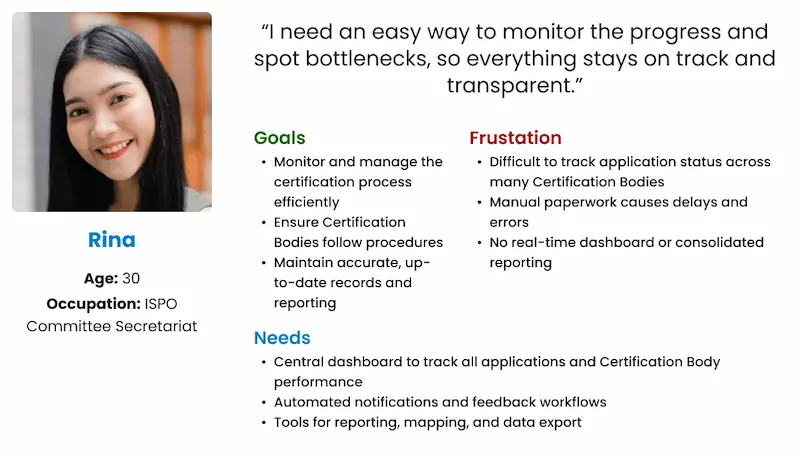
4. Research & Discovery
To understand the process better, I worked directly with stakeholders:
- Held interviews with the ISPO Committee Secretariat and several Certification Bodies to understand their day-to-day challenges
- Mapped out the entire manual workflow — start to finish — to spot bottlenecks and find improvement areas
- Focused on personas from the Secretariat and Certification Bodies, since that’s where most insights came from
Note: I didn’t conduct direct interviews with plantation owners or business applicants — so the research reflects the internal stakeholder perspective.
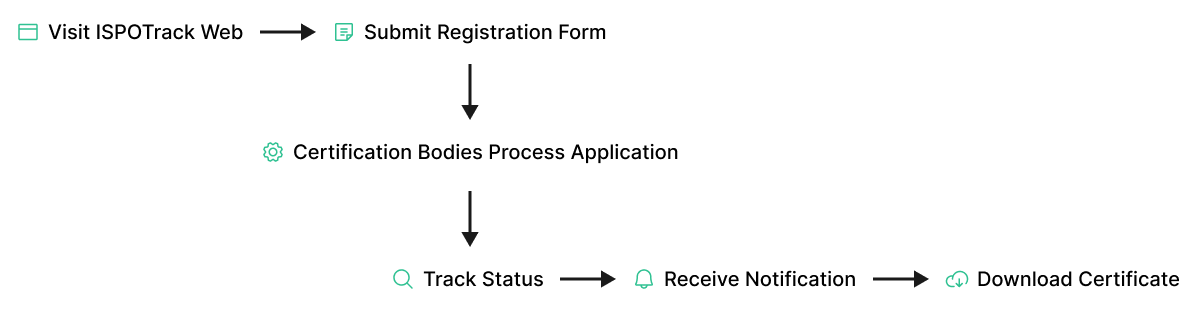
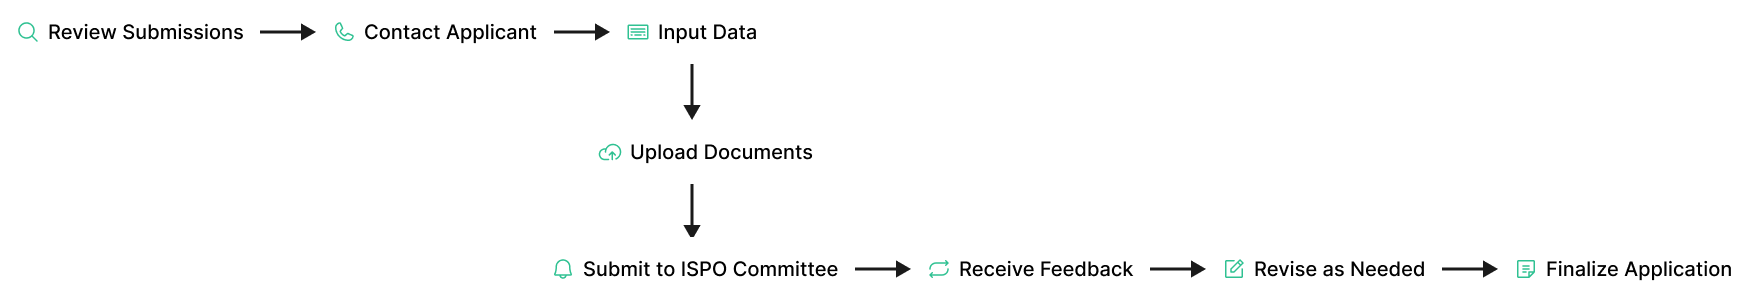
5. User Flow & Information Architecture
Business/Applicant Flow
LS Flow
ISPO SecretariatCommittee Flow

National Accreditation Committee Flow

6. Wireframe & Ideation
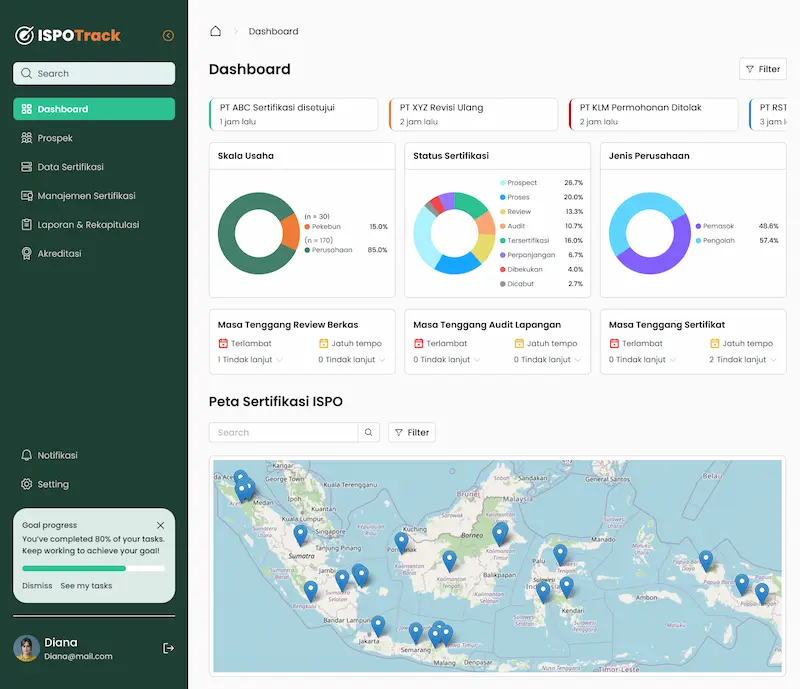
- Started with clean, focused dashboard wireframes
- Included status indicators, filters, and task-specific flows for different roles
- Iterated with feedback from peers to reduce friction, simplify layout, and highlight the most important actions
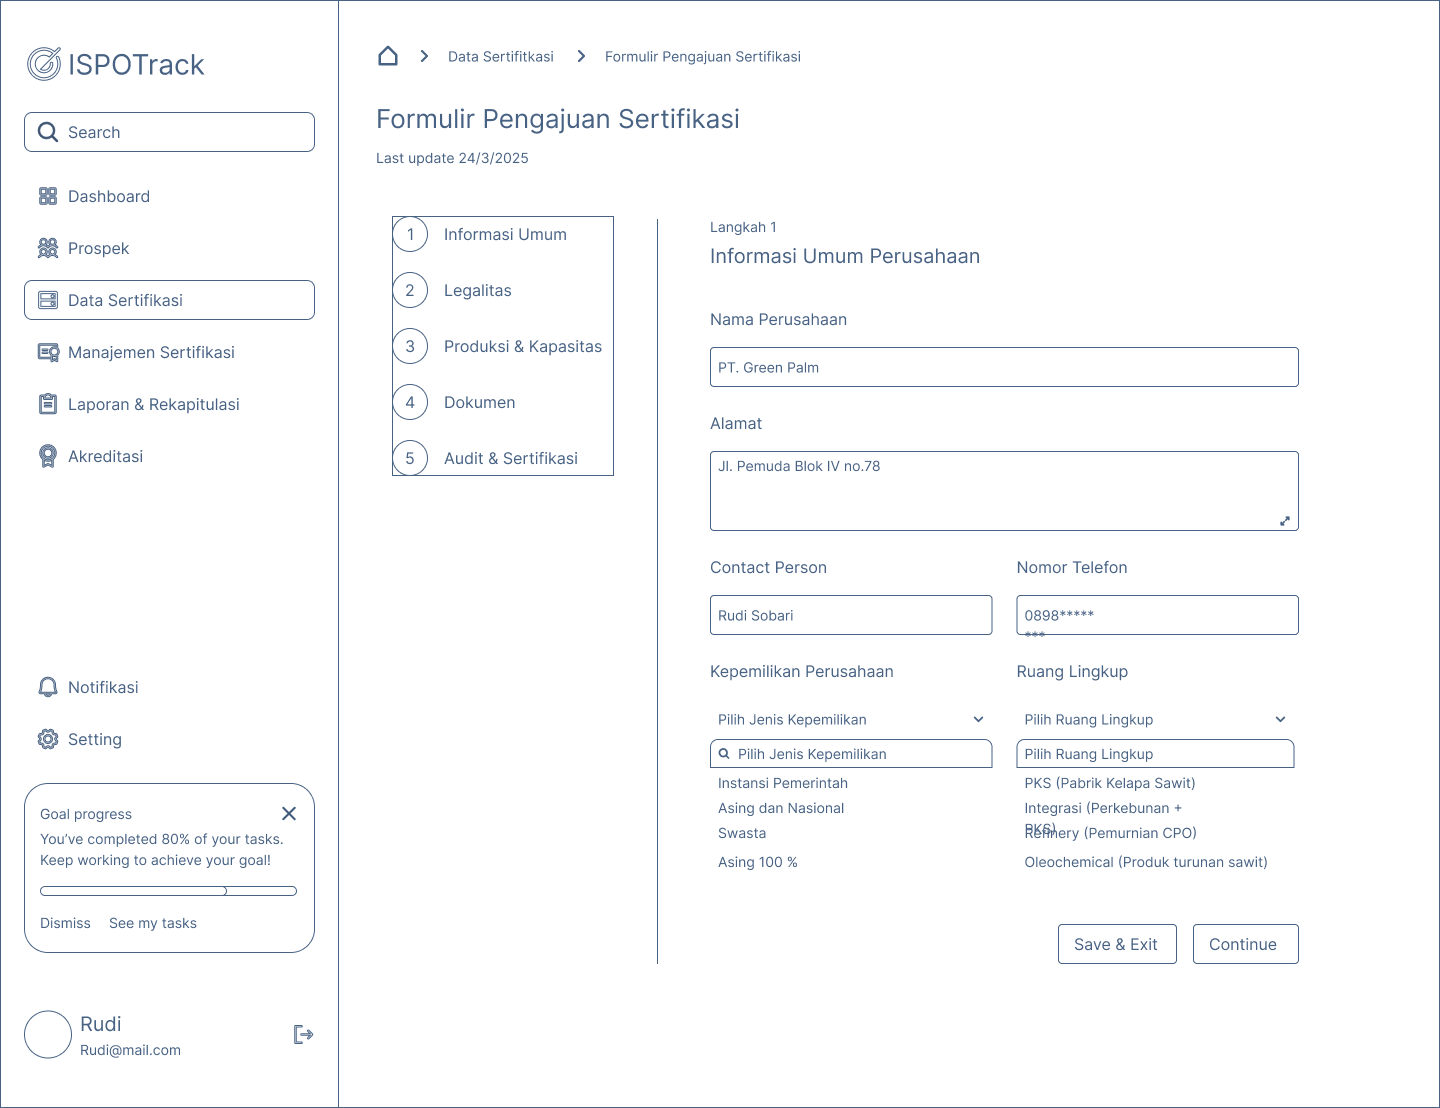
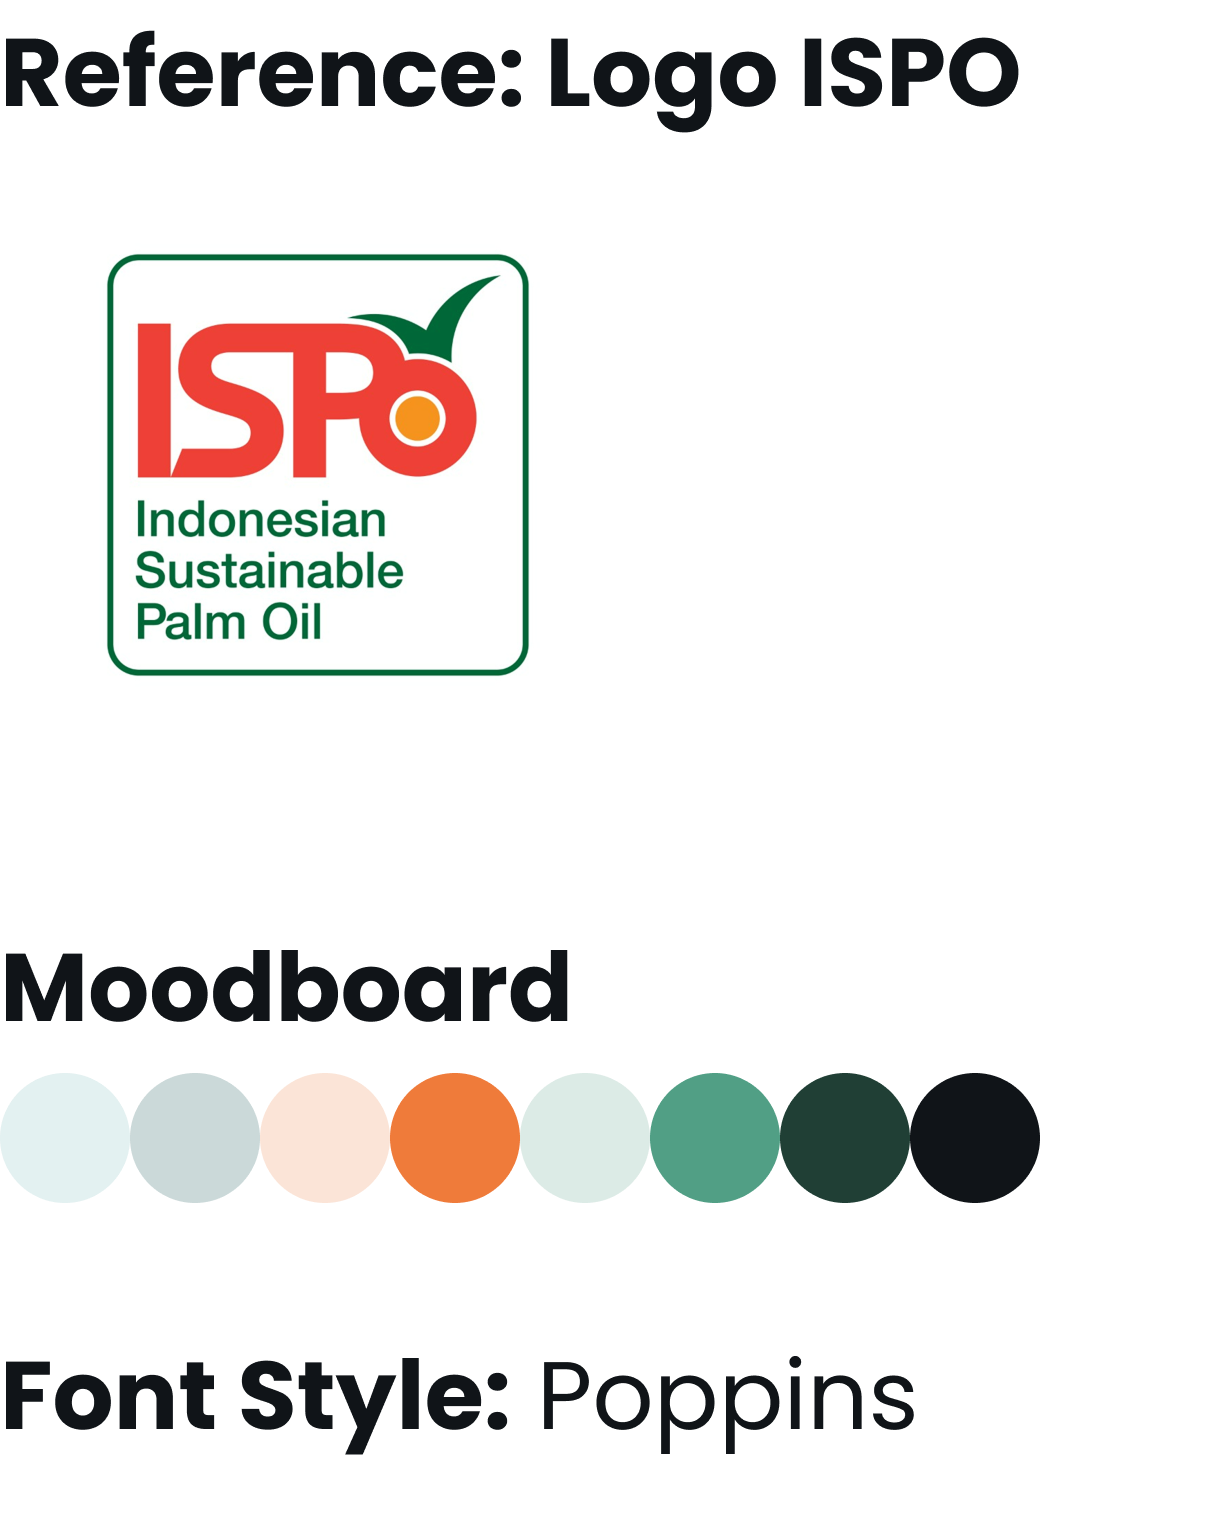
7. Visual Design
- Built on earlier UI concepts, polishing them into a modern, responsive system
- Used the ISPO Track color palette for visual consistency with future brand assets
- Designed badges, icons, and progress indicators for quick scanning
- Made sure layouts were easy to use on both desktop and mobile — key for different roles working in different environments
8. Prototype & Interaction
- Created a clickable prototype to walk through the end-to-end process
- Key flows include multi-step forms, document upload, progress tracking, notifications, and dashboard filtering
- Focused on intuitive transitions, clear feedback, and minimal friction between steps
9. Design Rationable
Why the design works:
- The dashboard brings everything together — no more scattered paperwork
- Each role sees only what they need — avoiding clutter and confusion
- Progress bars and notification systems reduce uncertainty and boost clarity
- Digital document handling speeds up approval and adds security
- A professional, modern UI builds trust in the overall certification process — which helps drive adoption
10. Before & After Comparison
Manual/Old Workflow | ISPO Track Dashboard | |
|---|---|---|
Submission | Paper/email, scattered | Online, guided, centralized |
Status Tracking | None or ad-hoc | Real-time, visible to all roles |
Data Management | Manual, error-prone | Secure, digital, role-based |
Notifications | Manual, slow, inconsistent | Instant, automated, clear |
Analytics/Reports | None or Excel-based | Live dashboard, exportable reports |
11. Outcome & Impact
- Huge reduction in manual work and endless back-and-forth via email
- Stakeholders can now see what’s happening in real time
- Bottlenecks are easier to identify and solve
- Built a foundation for future reporting, analytics, and integrations (like APIs with government databases)
- During prototyping and early testing, users responded positively and trusted the system more
12. Status & Next Steps
- Mapping out stakeholders early on was key — especially in a complex, multi-role system
- Prototyping helped uncover issues before they became real problems
- Tech is only half the equation — you also need to guide users through change
- Constant feedback and iteration is the only way to make something scalable and reliable
- Even though this is a conceptual redesign, it’s been an important project for me to grow my thinking around system-level UX
13. Disclaimer
This case study is a conceptual redesign, created for demonstration and portfolio purposes only. All visuals, workflows, and user roles shown here are fictional and do not represent an official ISPO product.